Back
Blogs
Profiling Python Performance: Systematic Measurement with cProfile and SnakeViz
27 Dec, 2025
•
11.44 AM
BLOG

Other Blogs

Scaling PyTorch Training Across GPUs: Mastering Data Parallelism in Real Projects
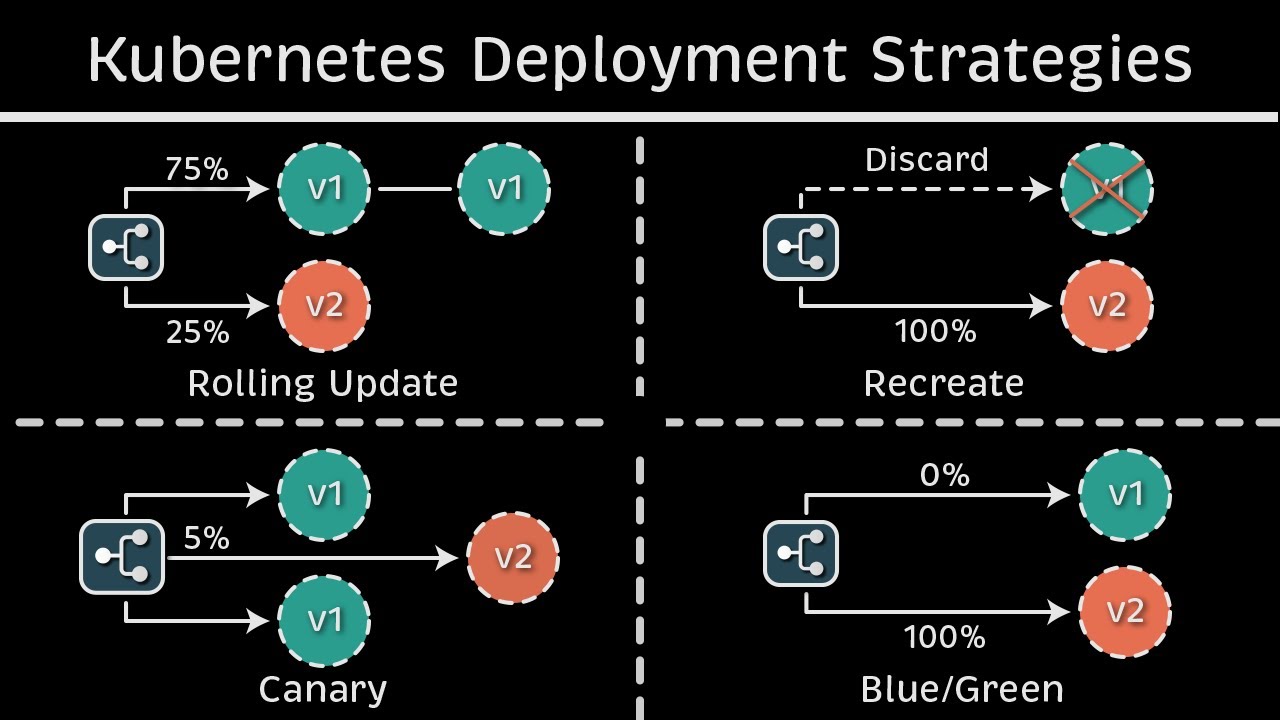
Is Kubernetes rolling update truly zero downtime ?

Business Development Executive Job Description: Top Duties and Qualifications
Sitecore JSS and Sitecore Docker

What is the difference between Sitecore SXA and Sitecore JSS